Introduction
Analytics 360 is Tagger's advanced performance analysis module — a complete pipeline that transforms raw tagged event data into polished, presentation-ready insights. From the moment you load a game, you have access to powerful tools for cleansing, exploring, measuring, visualizing, and presenting your team's data, all within a single integrated workspace.
What is Analytics 360?
Analytics 360 extends Tagger's tagging engine with a dedicated analytics environment purpose-built for sports analysts and coaches. Where Tagger captures the events, Analytics 360 makes sense of them — aggregating, filtering, and surfacing the patterns that matter most.
Tagger vs. Analytics 360
The Tagger dashboard is optimised for in-game and single-game analysis — reviewing the current match, examining individual events, and making real-time coaching decisions. It gives you a focused lens on one game at a time.
Analytics 360 shifts the perspective to season-wide performance. By loading multiple games into the pipeline, you can analyse trends across an entire season, compare performances game-over-game, and build insights that span your full body of work. This season-level view unlocks capabilities that a single-game focus cannot:
- Dashboards that reveal trends over time — track metrics across weeks or months, identify patterns, and see how performance evolves.
- Cross-game clip playlists — curate video clips from different games into a single playlist, perfect for player development reels, opponent scouting, or themed review sessions.
- Presentations that combine visualizations and playlists — build slide decks that mix data-driven charts with video evidence, creating compelling narratives for coaching staff, players, and management.
The module is organised around a linear pipeline, but every stage remains accessible at any time. You can jump directly from a loaded game to building visualizations, or from an event query straight into a presentation deck. The pipeline provides structure without constraint.
Analytics 360 is designed to work with games tagged in Tagger. If you're new to Tagger's tagging workflow, start with the Tagger Introduction before diving in here.
Availability
Analytics 360 is available exclusively in Tagger Desktop and requires the Analytics 360 package to be enabled on your account. It is not included with the base Tagger licence — contact your Teamoppy account manager or visit the pricing page to add Analytics 360 to your subscription.
The Analytics Pipeline
Analytics 360 is organised into ten workspaces — each a dedicated tab — that follow the natural flow of sports performance analysis:
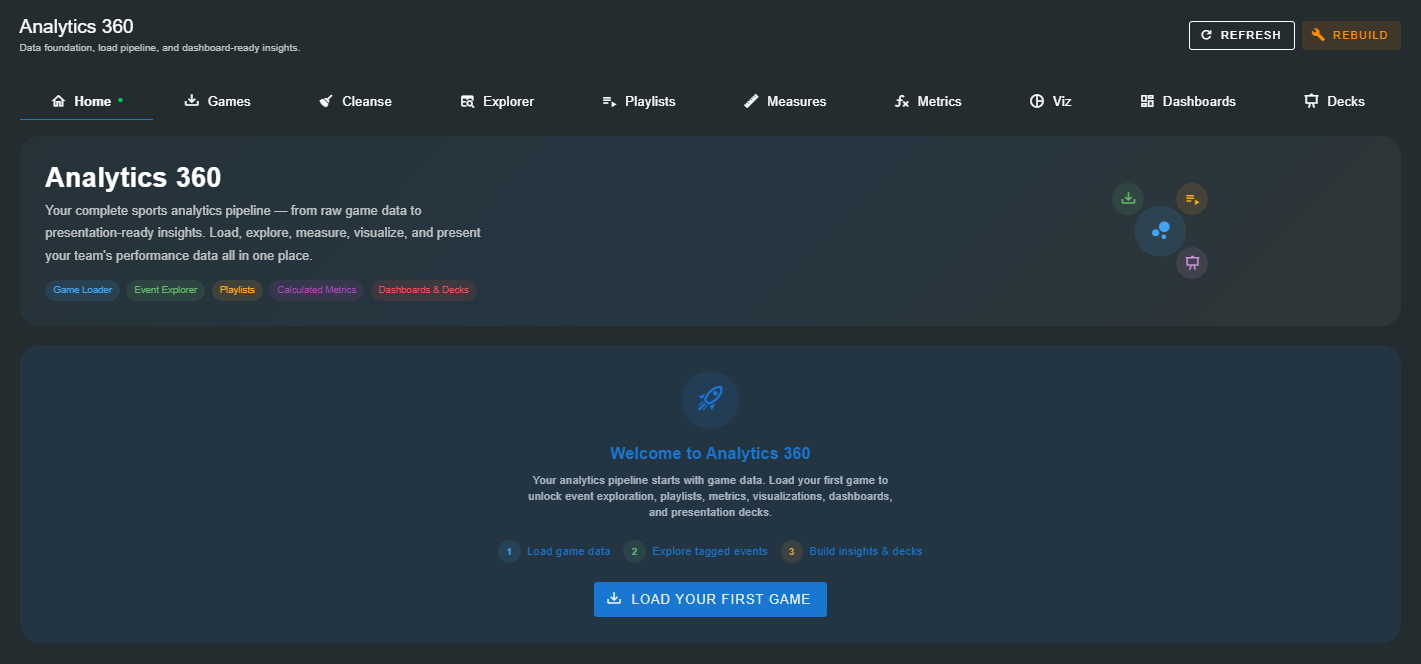
1. Home
The landing page. See a high-level summary of your analytics environment, including loaded games, pipeline progress, event counts, and quick-access links to dashboards, playlists, and decks. When no games are loaded, Home guides you through the setup process with clear next steps.
2. Games
Select and load games into the analytics pipeline. The Games tab lists every game available in your Tagger database — choose which matches to load, monitor import progress, and manage the games available for analysis. Each loaded game becomes the foundation for every downstream capability.
3. Cleanse
Standardise and normalise event data before analysis. Define cleanse rules to rename teams, players, or event labels, merge duplicate entries, or exclude unwanted events. Cleanse ensures your data is consistent and accurate before it feeds into metrics and visualizations.
4. Explorer
Filter, search, and browse every tagged event across your loaded games. The Explorer tab provides a powerful query interface with column-level sorting, multi-dimensional filters (game, team, player, event name, period, and more), and direct links to video clips. It's the investigative heart of Analytics 360.
5. Playlists
Curate collections of video clips from tagged events — pulling from a single game or across your entire season. Build playlists manually from the Explorer, reorder clips, and play them back with multi-angle video support. Because Analytics 360 works across all loaded games, you can assemble clips from different matches into one playlist — ideal for player development reels, opponent scouting across multiple fixtures, or themed review sessions.
6. Measures
Define reusable event-count measures — simple, named aggregations like "Total Tackles", "Passes into the 22", or "Turnovers in Midfield". Measures are the building blocks that feed into calculated metrics and visualizations, giving you a consistent vocabulary for the events that define your sport.
7. Metrics
Create calculated metrics using a flexible expression editor. Combine measures, reference other metrics, apply arithmetic and statistical functions, and scope calculations to specific games, teams, or players. Metrics turn raw counts into meaningful performance indicators like "Tackle Success Rate" or "Average Possession Retention".
8. Viz
Design visualizations from your measures and metrics. Choose from KPI cards, bar and pie charts, line and area trends, position maps, and detailed data tables. Each visualization is saved independently and can be reused across multiple dashboards and decks.
9. Dashboards
Assemble visualizations into structured dashboards using a drag-and-drop layout designer. Arrange KPI cards, charts, tables, and position maps into rows and columns, apply global filters, and create multiple dashboards for different audiences — coaching staff, players, or management. Because dashboards draw from season-wide data, they excel at revealing trends over time: track a player's tackle success rate across ten games, compare team possession game-over-game, or monitor set-piece effectiveness as the season progresses.
10. Decks
Build slide-based presentation decks for meetings, reviews, and reports. Each slide can embed visualizations, playlist clips, rich text commentary, and custom backgrounds. Decks are where the pipeline's strengths converge — combine a chart showing season-wide trends with a playlist of key moments from different games on the same slide. Decks turn data into a narrative, blending statistical evidence with video proof for the most compelling team reviews.
Key Concepts
Understanding these core entities will help you navigate the documentation and the Analytics 360 interface:
| Concept | Description |
|---|---|
| Game | A tagged match loaded into Analytics 360. Contains all events, teams, players, periods, and video source references. |
| Event | A single tagged occurrence within a game — a tackle, a pass, a score, or any custom event defined in your Tagger configuration. Each event carries metadata: time, team, player, period, and optional labels. |
| Playlist | A curated, ordered collection of video clips linked to specific events. Playlists can be played back, exported, and embedded in decks. |
| Measure | A named, reusable event-count definition — for example, "Total Tackles by Team A". Measures reference specific event names, teams, and optional filters. |
| Calculated Metric | An expression-based metric that derives a value from measures and other metrics. Supports arithmetic, ratios, and scoping by game, team, or player. |
| Visualization | A saved graphical or tabular representation of data — KPI cards, charts, position maps, or data tables — built from measures or calculated metrics. |
| Dashboard | A layout of multiple visualizations arranged in rows and columns, optionally filtered by a global scope. Dashboards are read-only in presentation mode. |
| Deck | A slide-based presentation composed of visualizations, playlist clips, and rich text. Decks are designed for sharing insights in meeting and review formats. |
Getting Started
Analytics 360 is ready as soon as you open it — no additional setup or configuration is required. The workflow is simple:
- Load game data — Load games from your Tagger database in the Games tab to make them available for analytics.
- Explore tagged events — Use the Explorer to filter, sort, and inspect your event data.
- Build insights and decks — Create measures, metrics, and visualizations. Assemble them into dashboards and presentation decks.
Analytics 360 requires games that have been tagged in Tagger and saved to your Games database. The module does not support direct video import or live tagging — tagging must be completed in Tagger first.
Feature Summary
| Tab | Purpose |
|---|---|
| Home | Landing page with pipeline summary, counts, and quick-access links |
| Games | Select and load games from your Tagger database |
| Cleanse | Normalise and standardise event data |
| Explorer | Filter, search, and browse all tagged events |
| Playlists | Curate and play video clip collections |
| Measures | Define reusable event-count measures |
| Metrics | Create calculated performance metrics |
| Viz | Design KPIs, charts, position maps, and tables |
| Dashboards | Assemble visualizations into structured dashboards |
| Decks | Build slide-based presentation decks |
Next Steps
Start from the Home tab to get oriented, then load your first game and follow the pipeline through each workspace:
- Home — Get an overview of your analytics environment
- Games — Load games from your database and manage your game library
- Cleanse — Normalise event data for consistent analysis
- Explorer — Filter and browse your event data
- Playlists — Build clip collections from tagged events
- Measures — Define the building blocks of your metrics
- Metrics — Create calculated performance indicators
- Viz — Design visualizations for dashboards and decks
- Dashboards — Assemble visualizations into dashboards
- Decks — Build presentation decks for meetings and reviews