Calculated Metrics
Calculated Metrics are derived performance indicators that combine existing measures and other calculated metrics using mathematical expressions. Unlike measures — which define what to aggregate from raw events — calculated metrics define how to combine those aggregations into higher-level insights like rates, ratios, efficiency scores, and weighted indices.
Overview
The Calculated Metrics tab operates in two modes: a list view showing every metric you have defined, and an editor view for creating or modifying individual metrics. A third debug evaluation dialog provides deep inspection of how expressions resolve under specific scope and filter settings.
List View
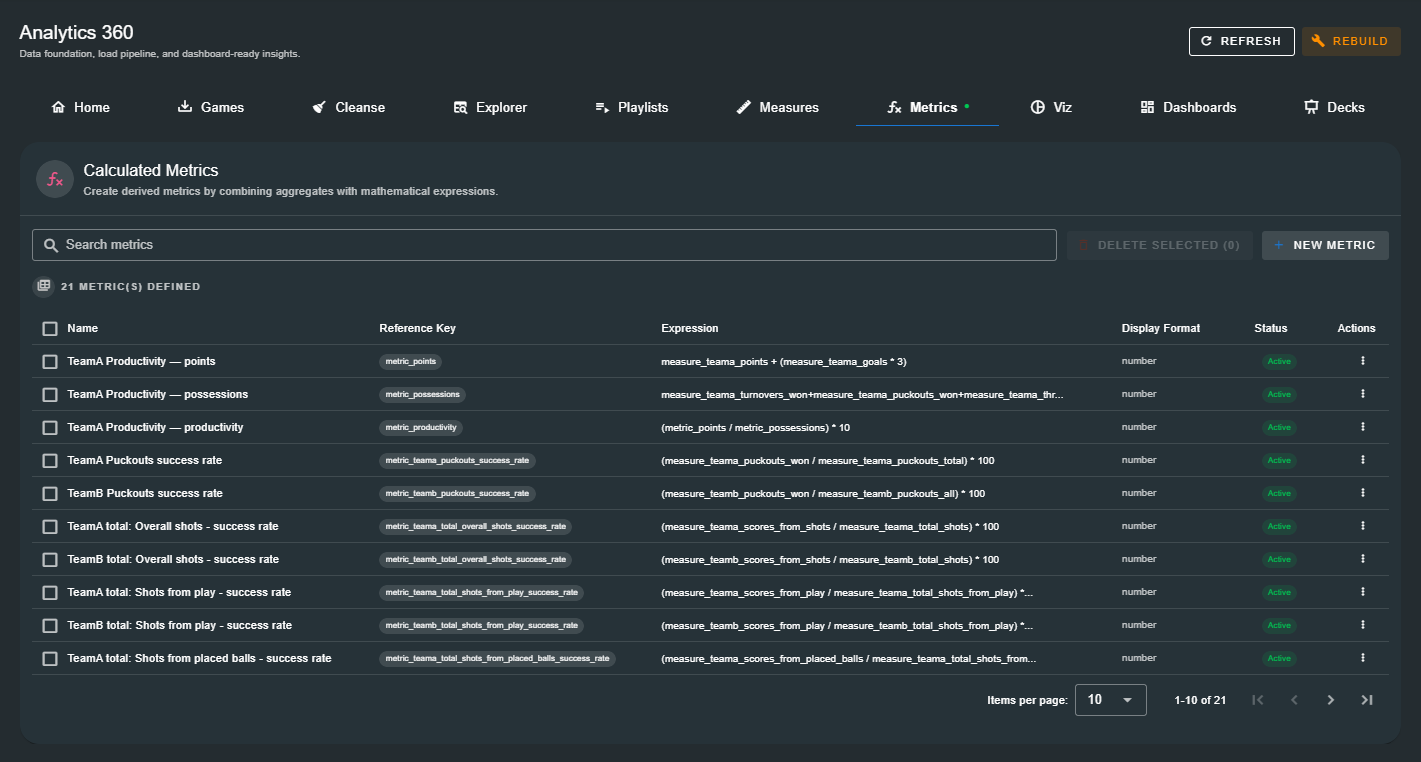
When metrics exist, the list view displays a table with the following columns:
| Column | Description |
|---|---|
| Name | The human-readable name of the metric (e.g. "TeamA total: Overall shots - success rate"). Click any row to open the editor. |
| Reference Key | A unique, auto-generated key used to reference the metric in other calculated metric expressions (e.g. metric_teama_total_overall_shots_success_rate). Displayed as a chip. |
| Expression | A preview of the mathematical expression, truncated to 72 characters. Full expression is visible in the editor. |
| Display Format | How the metric value is presented: display style (number or percent), decimal places, prefix, and suffix. |
| Status | Active (green) or Inactive (grey). Inactive metrics are excluded from visualizations and dashboards. |
| Actions | Kebab menu (⋮) with Edit and Delete options. |
Above the table, a search bar filters metrics by name, reference key, or expression in real time. A count badge shows the total number of defined metrics (e.g. "21 Metric(s) Defined"). Checkboxes on each row enable bulk delete — select multiple metrics and click Delete Selected (n) to remove them all at once.
Empty State
When no metrics have been defined, the page displays a prompt to create your first one — explaining that calculated metrics combine aggregate references with math expressions to produce derived values like shooting percentages, efficiency ratios, or possession quality scores.
Expression Syntax
Calculated metrics use a simple mathematical expression language. The expression is evaluated by substituting each reference key with its computed aggregate value, then applying the operators.
Operators
| Operator | Description | Example |
|---|---|---|
+ | Addition | measure_a + measure_b |
- | Subtraction | measure_a - measure_b |
* | Multiplication | measure_a * 100 |
/ | Division | measure_a / measure_b |
( ) | Grouping / precedence | (measure_a + measure_b) / 2 |
round() | Round to nearest integer | round(measure_a / measure_b) |
floor() | Round down | floor(measure_a / 60) |
ceil() | Round up | ceil(measure_a / 10) |
abs() | Absolute value | abs(measure_a - measure_b) |
min() | Minimum of arguments | min(measure_a, measure_b) |
max() | Maximum of arguments | max(measure_a, measure_b) |
Reference Key Pattern
Reference keys must match the pattern [a-zA-Z_][a-zA-Z0-9_]*. The following prefixes indicate the source type:
| Prefix | Source | Example |
|---|---|---|
measure_ | A Count measure | measure_teama_total_shots |
duration_ | A Duration measure | duration_teama_possession |
distance_ | A Distance measure | distance_ball_progression |
metric_ | Another calculated metric | metric_teama_shot_success_rate |
count_ | A raw event count aggregate | count_complete_pass |
Examples
measure_teama_scores_from_shots / measure_teama_total_shots
(measure_teama_scores_from_shots / measure_teama_total_shots) * 100
(measure_teama_puckouts_won + measure_teamb_puckouts_won) / 2
round(measure_teama_total_shots / 10) * 10
Use the Available Metrics panel on the right side of the editor to browse all referenceable measures and metrics. Click any entry to insert its reference key at the cursor position in your expression.
Creating a Metric
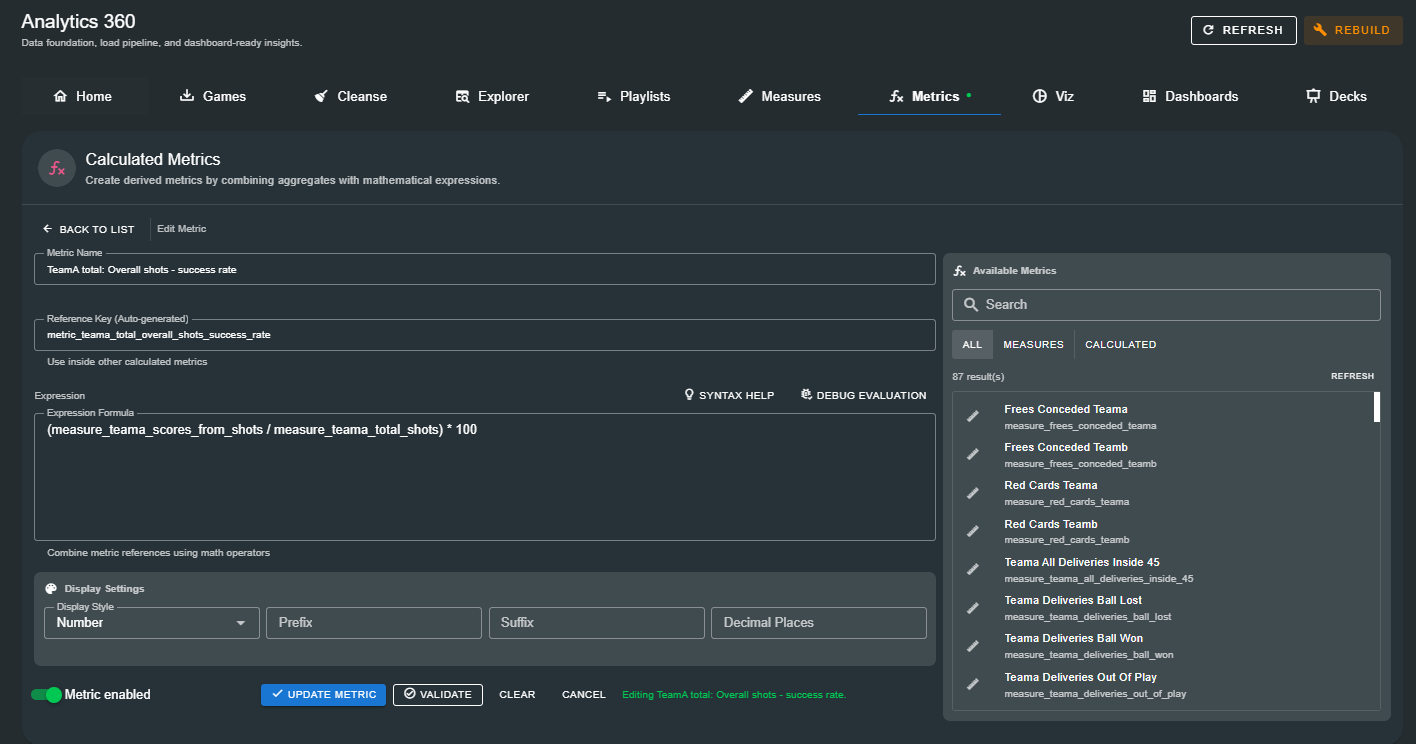
Click New Metric (or Create Your First Metric when the list is empty) to open the editor.
Core Fields
| Field | Description |
|---|---|
| Metric Name | A descriptive name for the metric (e.g. "TeamA total: Overall shots - success rate"). Required. |
| Reference Key | Auto-generated from the metric name. Read-only. Serves as the identifier for referencing this metric inside other calculated metric expressions. |
| Expression | The mathematical formula combining reference keys. Supports the operators and functions listed above. Whitespace is ignored. Required. |
Display Settings
Every calculated metric has configurable display options that control how its value is rendered in tables, KPIs, and charts:
| Setting | Description | Default |
|---|---|---|
| Display Style | Number (raw value) or Percent (value multiplied by 100 with a % appended). | Number |
| Prefix | A string prepended to the formatted value (e.g. $, €). | (none) |
| Suffix | A string appended after the formatted value (e.g. /game, pts). | (none) |
| Decimal Places | Number of decimal digits to show (0–10). When unset, defaults to 2 for Number style and 0 for Percent style. | (auto) |
Percent vs expression: If your expression already multiplies by 100 (e.g. (a / b) * 100), set Display Style to Number to avoid double-multiplication. Use Display Style Percent when your expression computes a raw ratio (e.g. a / b) and you want the UI to handle the ×100 and % suffix.
Enabled Toggle
Set the Metric enabled switch to activate or deactivate the metric. Disabled metrics are preserved in the database but excluded from all visualizations, dashboards, and downstream calculated metric evaluations.
Validating an Expression
Click Validate to check your expression without saving. The validation:
- Parses the expression for syntax errors
- Checks that all referenced keys are recognized (loaded aggregates and existing calculated metrics)
- Returns the list of available reference keys for the current context
A green success message confirms the expression is valid. A red error message describes any problems — for example, referencing a key that does not exist, using an unsupported character, or a syntax error in the operator arrangement.
Validation also populates the Available Metrics panel with the full set of referenceable keys, including measures loaded from the database. Use the filter buttons (All / Measures / Calculated) and search bar to quickly find the key you need.
Syntax Help Dialog
Click Syntax Help to open a reference panel showing:
- Allowed operators:
+,-,*,/, and parentheses - Metric reference pattern:
[a-zA-Z_][a-zA-Z0-9_]* - Examples: Common expression patterns
- Notes: Constraints like "Only loaded aggregate metric keys are valid references" and "Function calls are not supported" (except the built-in
round,floor,ceil,abs,min,max)
Debug Evaluation
The Debug Evaluation dialog (accessible via the Debug Evaluation button in the editor) provides deep inspection of how a calculated metric resolves. This is invaluable for verifying that expressions produce expected values and diagnosing mismatches between expression evaluation and persisted results.

Workflow
Step 1: Select Metric to Debug — Choose any calculated metric from the dropdown.
Step 2: Set Evaluation Scope — Narrow the evaluation context with optional filters:
| Filter | Description |
|---|---|
| Teams | Restrict to events from specific teams |
| Players | Restrict to events involving specific players (filtered by selected teams when team→player mapping data is available) |
| Games | Restrict to specific games (filtered by selected teams) |
| Periods | Restrict to specific periods (1–8) |
Click Evaluate to run the expression through the filtered scope.
Results Panel
The results panel shows:
| Section | Description |
|---|---|
| Original Expression | The expression as stored in the database |
| Resolved Expression | The expression with each reference key replaced by its scoped numeric value |
| Raw Value | The computed result of evaluating the resolved expression |
| Formatted Value | The result formatted according to the metric's display settings (prefix, suffix, decimals, percent) |
| Status | Valid (green) or Error (red) with the error message if evaluation failed |
Scope Comparison
The debug dialog compares the expression value (computed on-the-fly by evaluating the expression with scoped base values) against the persisted value (the value stored from the most recent full analytics rebuild). A Delta column shows the difference.
When these values do not match, a warning alert explains: "This usually indicates mixed filter dimensions or stale materialized data. Consider rebuilding analytics."
Reference Breakdown
A table lists every reference key found in the expression, with:
- Reference: The key name
- Value: The numeric value in the current scope
- Source: base (from raw aggregate values), calculated (from another calculated metric), or unknown (not found in any source)
- Rows: The number of contributing rows for the reference
The Debug Evaluation dialog re-fetches a filtered overview from the backend when scope filters are active, ensuring values reflect the exact team/player/period/game combination you have selected — independent of the main UI state.
Finding and Inserting References
The right-hand Available Metrics panel in the editor helps you discover and insert reference keys:
- Search — Type to filter by metric name or reference key
- Source filter — Toggle between All, Measures (measure/duration/distance keys), or Calculated (metric_ prefixed keys)
- Click to insert — Click any entry to append its reference key to the end of your expression, preceded by a space if the expression is not empty
The panel displays each reference with:
- An icon indicating source type: ruler (measure), calculator (calculated), or chart-bar (aggregate)
- A human-readable label derived from the key name
- The raw reference key as a subtitle
Click Refresh to reload the available references from the database — useful after creating new measures or metrics in another session.
Saving a Metric
Once you have configured the metric:
- Click Save Metric (or Update Metric for existing metrics).
- A success message confirms the save, including the persisted aggregate key.
- The form is reset so you can create another metric, or click Cancel / Back to List to return to the list view.
The new metric appears immediately in the list and is available for use in visualizations, dashboards, and as a reference in other calculated metric expressions.
Changes to calculated metrics take effect immediately in downstream consumers (visualizations, dashboards, and other calculated metrics) — but the persisted aggregate values may not update until the next analytics rebuild. Use the Debug Evaluation dialog to preview the effect of expression changes with current data.
Managing Metrics
Editing
Click any row in the list view, or use the kebab menu (⋮) → Edit, to open the metric in the editor. Make your changes and click Update Metric.
Deleting
Use the kebab menu (⋮) → Delete to remove a metric. A confirmation dialog asks you to confirm before the metric is permanently removed.
Auto-generated metrics (created during game loading from the Tagger game totals configuration) may be re-created on the next game load if deleted. The bulk delete dialog warns you when auto-generated metrics are among the selection.
Bulk Delete
Check multiple rows in the list view and click Delete Selected (n). All selected metrics are removed in sequence. The confirmation dialog shows the count and warns about any auto-generated metrics in the selection.
Searching
The search bar at the top of the list filters metrics by name, reference key, or expression in real time. Use it to quickly locate a specific metric in large configurations.
Auto-Generated Metrics
When a game is loaded into Analytics 360, calculated metrics can be automatically created from two sources in the Tagger game configuration:
From Totals Calculated Config (totalsCalculatedV2Config)
Each entry in the totals calculated config defines a metric by combining two operand totals with an operator:
- operand1 / operand2: References to other totals (measures or calculated metrics) by their config ID
- operator: One of
+,-,*,/, or%
For the % operator, the expression is automatically rewritten as (operand1 / operand2) * 100.
The system resolves dependencies across multiple passes — if a calculated metric references another calculated metric that hasn't been created yet, it retries on the next pass (up to 50 passes).
From Formulas Config (totalsFormulaConfig)
Formula-based metrics allow freeform expressions referencing totals by their config IDs, resolved to their reference keys at creation time.
Deduplication
Auto-generated metrics are deduplicated by expression — if a metric with the same expression already exists (whether auto-generated or user-created), it is skipped rather than duplicated. Reference keys are also checked for uniqueness; if a conflict is found, a numeric suffix is appended (e.g. metric_shots_success_rate_2).
How Calculated Metrics Connect
Calculated metrics sit above measures in the Analytics 360 data model, bridging raw aggregations and every downstream consumer:
Tagged Events  →  Measures  →  Calculated Metrics  →  Visualizations (KPIs, charts, tables)
                          ↘                          →  Other Calculated Metrics (nested references)
A single calculated metric can power multiple visualizations and serve as a building block for even more complex derived metrics. Because calculated metrics can reference other calculated metrics, you can build layered analytical models — for example:
measure_teama_scores_from_shots / measure_teama_total_shots→ TeamA Shot Success Rate (ratio)(metric_teama_shot_success_rate + metric_teamb_shot_success_rate) / 2→ Average Shot Success Rate (composite of calculated metrics)
Calculated metrics are evaluated on-the-fly at query time from the analytics_events table. There is no pre-aggregation or materialized rebuild step — the expression engine substitutes current aggregate values into the expression and computes the result. This means metric values always reflect the most recent data for the selected scope.
Character Whitelist
For security, expressions are validated against a strict character whitelist. Only the following characters are allowed:
- Letters:
a–z,A–Z - Digits:
0–9 - Underscore:
_ - Operators:
+,-,*,/ - Grouping:
(,) - Decimal point:
. - Whitespace: space, tab, newline, carriage return
Any character outside this set — including Unicode symbols, homoglyphs, or special characters — causes a validation error with the message: "Expression contains unsupported character: char".
Next Steps
With calculated metrics defined, you are ready to surface them in visual outputs:
- Viz — Design visualizations powered by your measures and calculated metrics
- Dashboards — Assemble visualizations into structured dashboards
- Decks — Build presentation decks for meetings and reviews