Explorer
The Explorer is the investigative heart of Analytics 360 — a powerful query interface that lets you filter, sort, and browse every tagged event across all your loaded games. From a single discovery of a key moment to a systematic analysis of event patterns, the Explorer surfaces the raw data that drives every downstream insight.
Overview
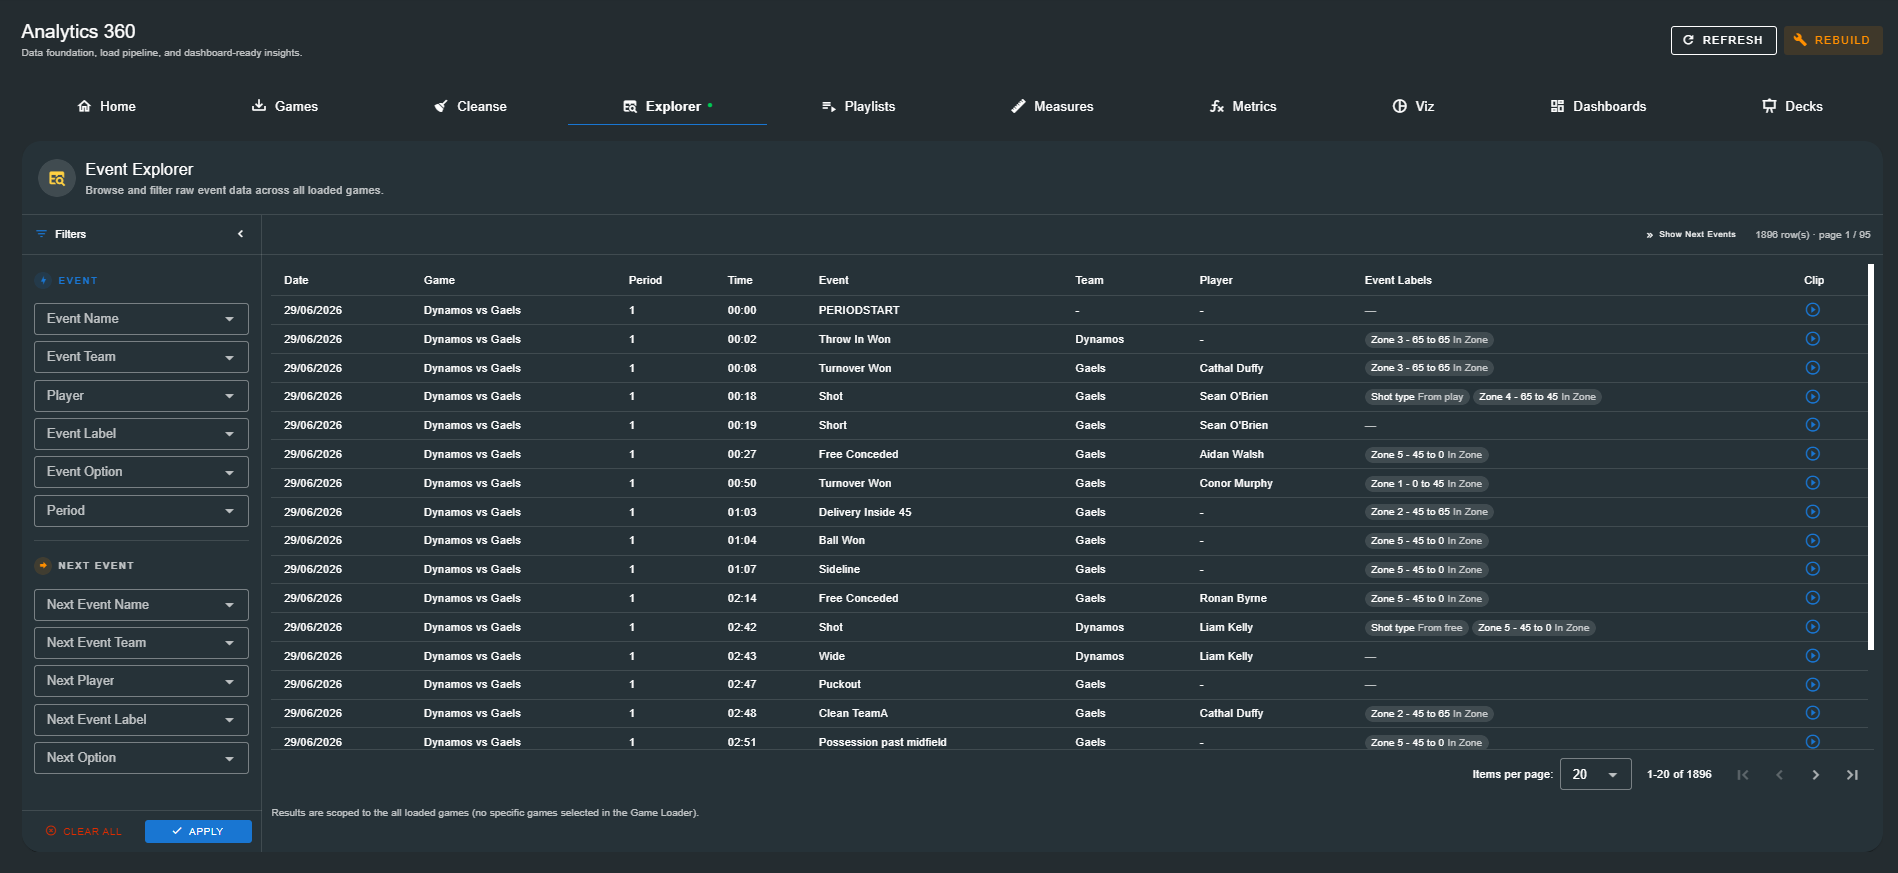
The Explorer presents a dual-pane layout: a filter sidebar on the left and a scrollable event table on the right. Filters narrow the dataset in real time; the table displays matching events with sortable columns, inline label chips, and direct links to video clips and playlists.
Layout
| Zone | Description |
|---|---|
| Filter Sidebar | Two filter groups — Event filters for the primary event and Next Event filters for the event that follows — each with dropdowns for name, team, player, label, option, and period. |
| Event Table | A paginated table displaying every event that matches the active filters, with columns for date, game, period, time, event name, team, player, labels, and a clip action. |
| Toolbar | Global actions including Refresh (re-query the events database) and Rebuild (re-process all loaded games). |
Filtering Events
The filter sidebar gives you precise control over which events appear in the table. Filters are organised into two groups, and both can be used simultaneously.
Event Filters
These filters constrain the primary event — the event itself.
| Filter | Description |
|---|---|
| Event Name | Select one or more event types (e.g. "Shot", "Tackle", "Turnover Won"). Only events matching the selected types are shown. |
| Event Team | Filter by the team that performed the event. |
| Player | Filter by the player who performed the event. The available players update based on the selected team. |
| Event Label | Filter by labels attached to the event (e.g. "Shot type", "Zone"). |
| Event Option | Filter by the specific option value within a selected label (e.g. "From play" within "Shot type"). Selecting an option requires first selecting its parent label. |
| Period | Restrict events to a specific period within the game. |
Next Event Filters
The Next Event group filters based on the event that follows the primary event in sequence. This is a powerful analytical tool — use it to answer questions like "How often does a Turnover Won lead to a Shot?" or "What happens after a Puckout?"
| Filter | Description |
|---|---|
| Next Event Name | Filter by the type of the following event. |
| Next Event Team | Filter by the team that performed the following event. |
| Next Player | Filter by the player who performed the following event. |
| Next Event Label | Filter by labels on the following event. |
| Next Option | Filter by option values on the following event's labels. |
Applying Filters
- Configure your filter selections in the sidebar.
- Click APPLY to execute the query. The event table updates to show only matching rows.
- Click CLEAR ALL to reset every filter to its default state.
The filter sidebar shows the count of active filters in each group, so you always know what is constraining your current view.
Combine Event and Next Event filters to answer sequence-based questions. For example: Event Name = "Turnover Won" + Next Event Name = "Shot" reveals every turnover that directly led to a scoring attempt.
The Event Table
The event table is the main workspace — a paginated, sortable view of every event that matches your active filters.
Columns
| Column | Description |
|---|---|
| Date | The date of the game. Sortable. |
| Game | The match name (e.g. "Dynamos vs Gaels"). Sortable. |
| Period | The period or half in which the event occurred. Sortable. |
| Time | The event time within its period, displayed in mm:ss format. Each period's clock starts at 0:00, so read this together with the Period column. Sortable. |
| Event | The event type name (e.g. "Shot", "Tackle", "Puckout"). Sortable. |
| Team | The team that performed the event. Sortable. |
| Player | The player who performed the event. Sortable. |
| Event Labels | Inline chips displaying labels and option values attached to the event (e.g. "Zone 3 – 65 to 65 in Zone", "Shot type – From play"). |
| Clip | A quick-action button to open the event's video clip. Only available for games linked to a video source (see Viewing Video Clips). |
Sorting
Click any sortable column header to sort ascending. Click again to toggle to descending. A third click removes the sort and returns to the default order. The active sort column and direction are indicated by an arrow icon in the column header.
Pagination
The event table paginates results to keep browsing fast and responsive. The pagination control at the bottom of the table shows the current page range and total row count (e.g. "1–20 of 1,896"). Use the page size dropdown to adjust how many rows are displayed per page.
Viewing Video Clips
Every event row includes a Clip action in the rightmost column. This button opens the video clip associated with that event — jumping directly to the exact moment in the match footage where the event occurred.
Requirements
The Clip action is only available when the game is linked to a video source. If a game was tagged without a video, or if the video file is not accessible, the Clip action is disabled and displayed in a muted state.
For the Clip action to work correctly, the game's event data and video must be synchronised in the main Tagger view before the game is loaded into Analytics 360. Synchronisation ensures that event timestamps align precisely with the video timeline. Use Sync Mode on the Tagger Timeline tab — see Synchronize Video. If you notice clips opening at the wrong moment, re-sync the game in Tagger and reload it in Analytics 360.
Clip Workflow
- Locate the event you want to review in the event table.
- Click the Clip button on the event's row.
- The integrated video player opens at the event's timestamp, allowing you to review the moment in context.
From the video player you can play, pause, scrub, and switch between available camera angles if multiple video sources are linked to the game.
Adding Events to a Playlist
The Explorer is also where you curate playlists — collections of video clips pulled directly from your tagged events. Rather than switching to the Playlists tab and searching for events again, you can add events to a playlist directly from the video player dialog.
Adding a Single Event
- Locate the event you want to include in the event table.
- Click the Clip button on the event's row to open the video player dialog.
- Inside the video player, review the clip to confirm it captures the moment you want.
- Click the ADD TO PLAYLIST button at the bottom of the video player.
- Choose an existing playlist from the dropdown, or select New Playlist to create one on the fly.
The video player dialog overlays the Explorer and provides full playback controls — play, pause, mute, and replay — along with event metadata such as period, timestamp, event name, player, and labels. This lets you verify the clip context before committing it to a playlist.
Refreshing and Rebuilding
Two toolbar actions sit above the event table:
| Action | Description |
|---|---|
| Refresh | Re-queries the events database with the current filter settings. Use this after loading a new game or modifying cleanse rules to ensure the table reflects the latest data. |
| Rebuild | Re-processes all loaded games from source — reapplying cleanse rules, recalculating derived data, and regenerating auto-created assets. Available from the global Analytics 360 toolbar at the top of every tab. |
Next Steps
The Explorer feeds directly into every downstream stage of the analytics pipeline:
- Playlists — Build clip collections from the events you have discovered
- Measures — Define event-count measures based on the patterns you observe in the Explorer
- Metrics — Create calculated metrics that quantify the relationships you uncover
- Viz — Design visualizations from the measures and metrics built on explored events