Metric Progressions Configuration
Configure Metric Progressions to show how your key metrics relate to one another, as a progressive list on your dashboard.
Metric Progressions
Metric Progressions are used to highlight key metrics and the relationships between them in your Dashboard. Where a Metric Highlight puts a single value on a prominent card, a Metric Progression walks through a sequence of totals — for example possessions, to attacks, to shots, to scores.
This component is only available to add on custom dashboards.
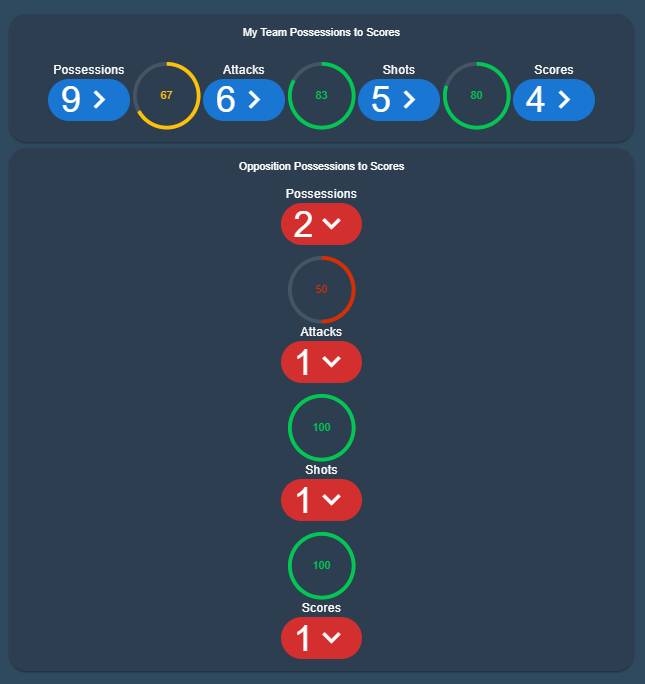
The Metric Progression
Each progression is a named sequence of items.
| Field | Description |
|---|---|
| Metric Progression Name (required) | The name of the progression. |
| Enabled | Only enabled progressions can be added to a dashboard. |
| Display Name | Switch this on to show the progression name on the dashboard card, above the items. |
Metric Progression Items
Items are the steps in the progression, and they are displayed in the order you add them. Add one item for each step.
| Field | Description |
|---|---|
| Total Name (required) | The name shown for the step. |
| Total Type | The type of total this step is based on. |
| Total | The total to display, chosen from your totals of the selected type. Shown for Count, Calculated, Event Duration and Play Time Duration totals. |
| Formula | For a Formula total, the formula to use. |
| Reference | For a Formula total, the reference within that formula. |
| Duration Value Type | Shown for Event Duration and Play Time Duration totals. Choose whether to display the Total for the game, or the Average. |
| Item Type | Chip or Progress. See below. |
| Color Type | Custom Color, Traffic Light, My Teams Color or Opposition Teams Color. |
| Size | How large the step is drawn, from 1 to 4. |
The Total Type can be any of the following:
| Total Type | Use it for |
|---|---|
| Count | A count of events, optionally filtered by team, zone, labels and linked events. |
| Calculated | A simple calculation combining two other totals. |
| Event Duration | The accumulated duration of an event, such as total possession time. |
| Play Time Duration | The accumulated time between two events. |
| Formula | A Formula Set, for more complex calculations. |
Chip or Progress
The Item Type decides how each step is drawn:
- Chip — the value is shown in a chip, with a chevron between steps to point at the next one.
- Progress — the value is shown in a circular progress indicator.
Chips have two extra settings:
| Field | Description |
|---|---|
| Variant | The chip style — flat, text, elevated, tonal, outlined or plain. |
| Rounded | The corner style — xs, lg, xl, pill, circle or shaped. |
Traffic Light Colours
When Color Type is Traffic Light, enter four threshold values and the colour is chosen from the range the value falls into.
Each subsequent value has to be greater than the previous value.
| Range | Colour |
|---|---|
| Value 1 to Value 2 | Red |
| Value 2 to Value 3 | Amber |
| Value 3 to Value 4 | Green |
Reverse Lights turns the logic around, so that a low value is shown as good and a high value as bad. That is useful for measures where a high number is a negative — errors or turnovers, for example.
Choosing Custom Color instead shows a colour picker, and My Teams Color and Opposition Teams Color take their colour from the teams configured for the game.
Preview
Each progression and each item has a Preview panel.
The preview uses data from the current game. If there is no game in progress the preview will not display any data.
Displaying a Progression on a Dashboard
When you add a Metric Progression to a custom dashboard in the Dashboard Designer, it has two properties:
- The progression to use — pick from your enabled Metric Progressions.
- Display Horizontal — switch this on to run the progression across the card instead of down it.
A Metric Progression cannot be deleted while it is still in use. If a progression is referenced by a dashboard or a report, remove it from there first.
Next Steps
- Metric Highlights — highlight single metrics on a dashboard card
- Totals Configuration — the totals these progressions are built from